ed.kinhcetssem-tamrof@ofni
+49-721-53118-42

We give online product presentations worldwide

EN DE

Foam Qualification System FOAMAT® 285


Measuring Physical Parameters During Foam Formation

FOAMAT

Measurement of:

  • Rise height
  • Temperature
  • Pressure
  • Curing
  • Weight loss
  • Flowability
  • Testing according to:

  • ASTM D 7487-18
  • EN 14315-1(Annex E)

  • * Patent Nos. 3621819, 19730891 and 10044952


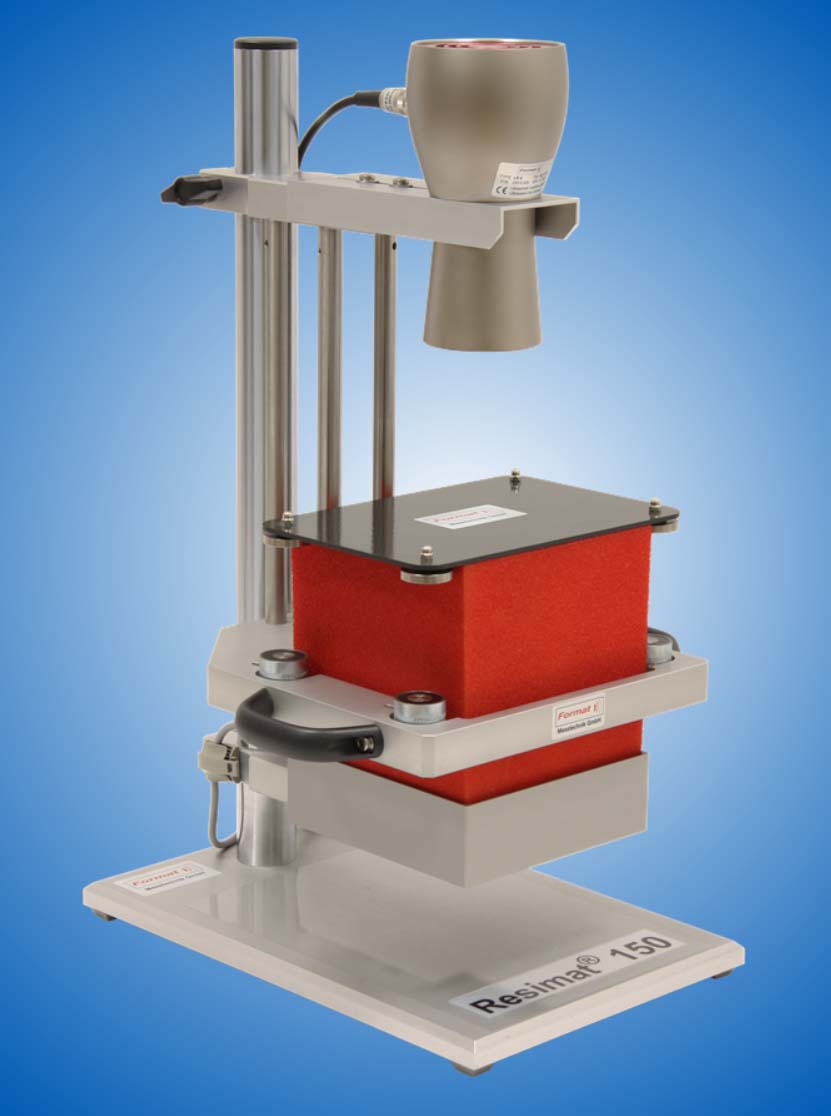
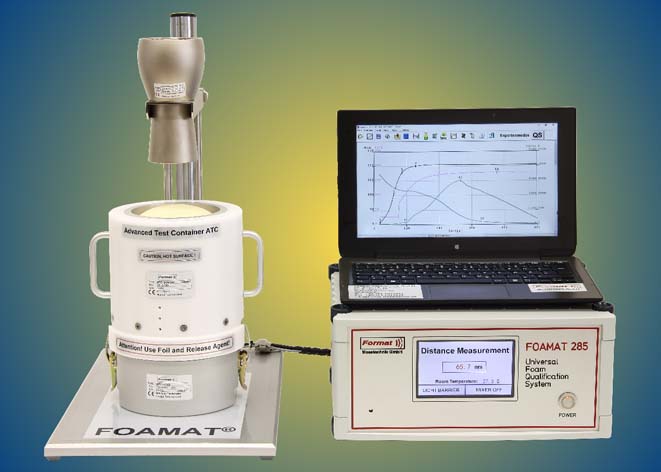
    Figure 1: The Universal Foam Qualification System FOAMAT 285 is based on innovative technology for precision testing of all kinds of plastic foams. The ultrasonic fan-sensor LR 4 provides high data repeatability under all testing conditions. The enhanced technology of the Advanced Test Container ATC shows detailed cell formation data by a high resolution pressure sensor. The FOAM V4.0 software has new features, including density and specific volume curves.

    top


    Video 1: FOAMAT 285 with ATC system overview and test of a rigid PU foam.


    top

    Formation Parameters


    The quality of polyurethane (PU), polyisocyanurate (PIR), phenolic and epoxy foams depends on the conditions during their formation. Therefore, it is sensible to record the formation parameters and to check representative samples regularly. Consistent product quality is ensured by measuring the formation parameters during the foaming process. The measured curves are compared to specified standards in the form of master curves. Many automotive systems suppliers apply this method to vehicle-interior parts and modules. The furniture industry, along with the construction and equipment insulation industry, also measure formation parameters for quality assurance purpose. When foam parts with special properties are being developed, measuring the foam formation parameters gives an insight into how the reaction is proceeding and how foam formation can be affected by additives, blowing agents, stabilizers, and the mixing ratio. By offering different types of test containers, the Foam Qualification System FOAMAT combines versatility and high measuring accuracy.


    top

    Rise Profile


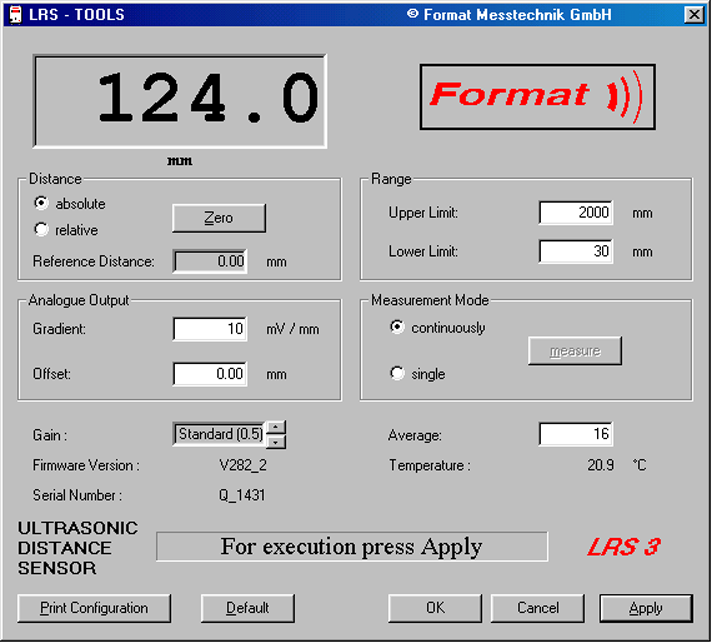
    The classic method of characterizing foams is to measure the rise height or rise profile. The expansion of a foam sample can be measured in a cup, a box, or a cylinder. The critical start time is evaluated from the rise rate. It indicates the start of the reaction between the reactive components after mixing. The rise time is another fundamental foam parameter. It is defined as the time between the start of mixing and the maximum expansion of the foam. The patented ultrasonic fan sensor LR4 of the FOAMAT system is especially designed for measuring the distance to the foam bun with high accuracy. It features an integrated fan for air homogenization, an ultrasonic sound transducer, and a temperature. All types of foams can be measured, including flexible molded and slabstock foams, semi-rigid foams, and rigid foams with strong heat release. The expansion containers can be heated to repeatable starting conditions as well as to reach the required reaction temperature. In quality assurance testing, the rise profile, which is the fingerprint of the foam, is compared to given master curves. A master curve is a tolerance band showing the margins of a “good” foam sample. While rise height measurement still continues to be the standard method of foam testing, new sensors of FOAMAT are available, revealing more details of the foam formation process.


    rigid foam

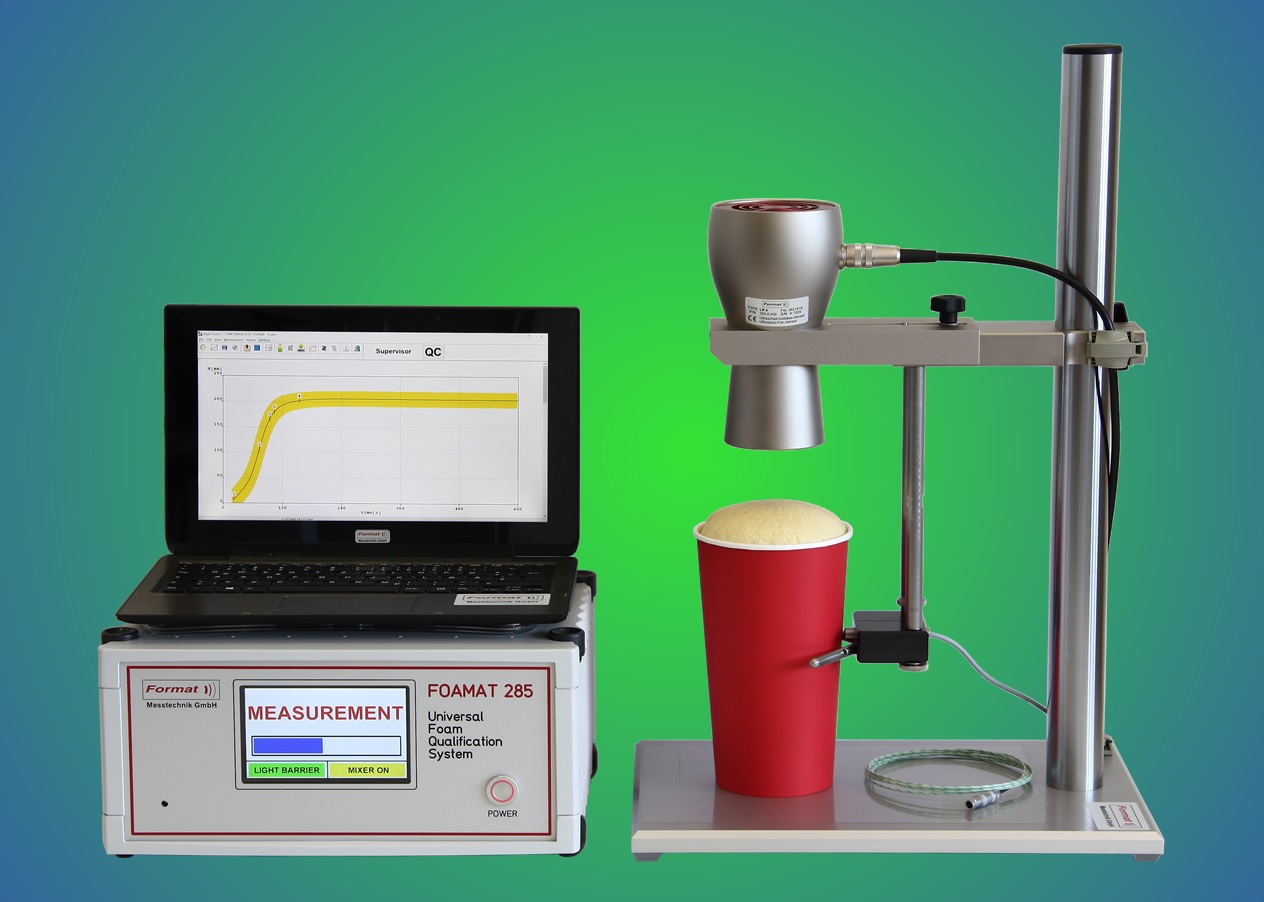
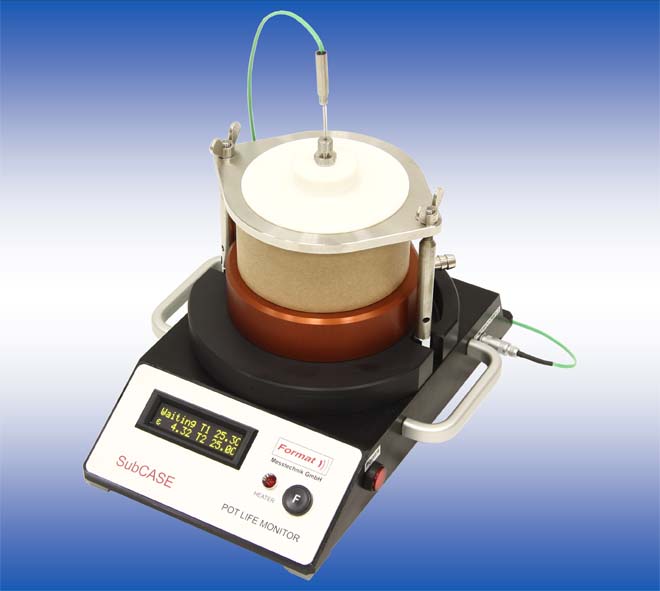
    Figure 2: The FOAMAT 285 base system comprises the ultrasonic fan sensor LR4 for rise height measurement, the temperature probe for core temperature measurement, the mechanical set, the controller unit, including the mixer control, and ther PC software FOAM.

    top

    Reaction Temperature


    The compound formation and the cross-linking reaction cause an exothermal temperature increase in the foam sample. Thin thermocouples are ideal for measuring the temperature inside the foam as they have a low heat capacity and are easy to apply. They hardly interfere with the foam formation and can be used repeatedly.


    rigid foam

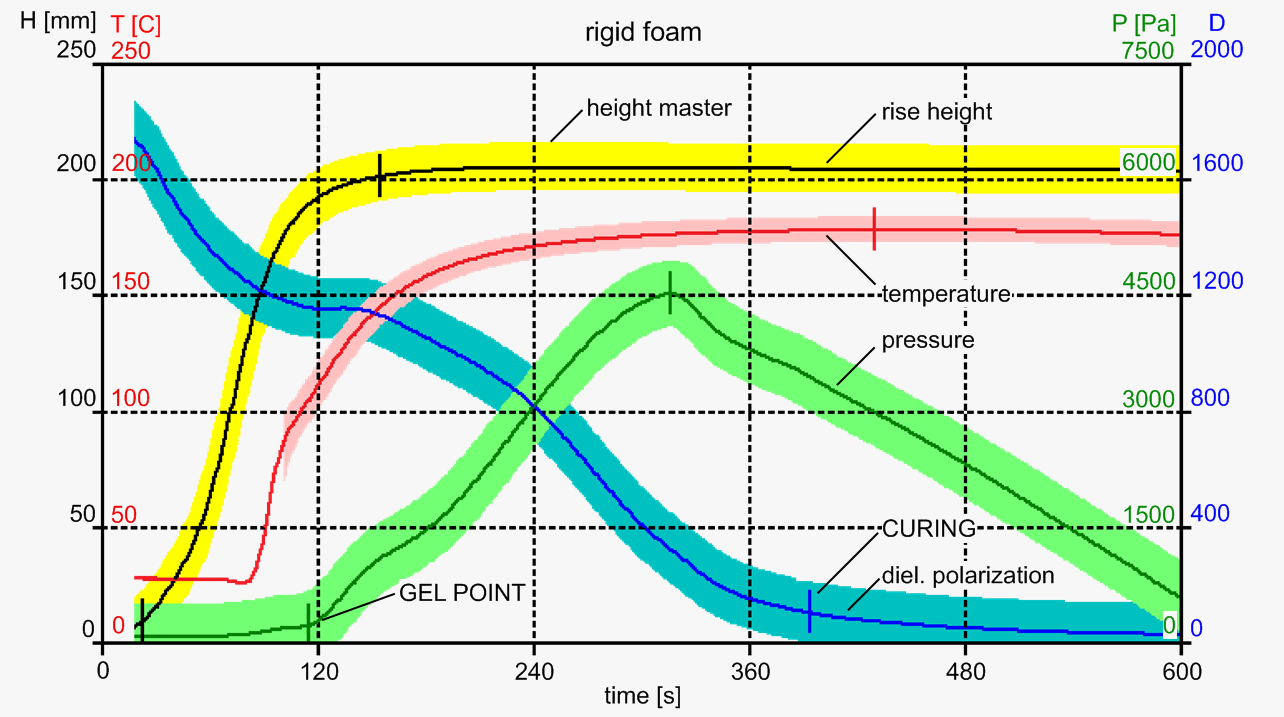
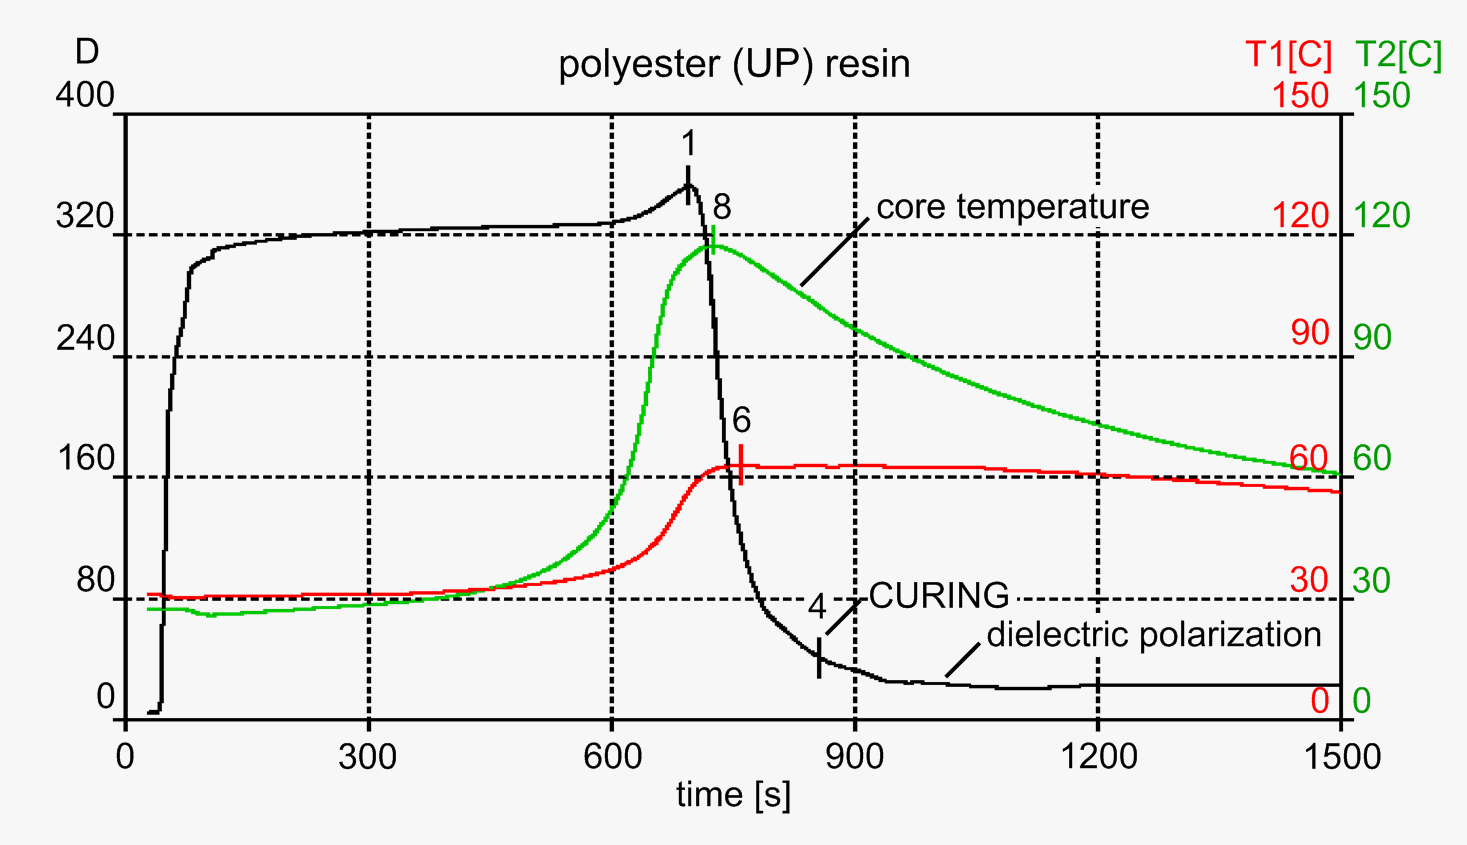
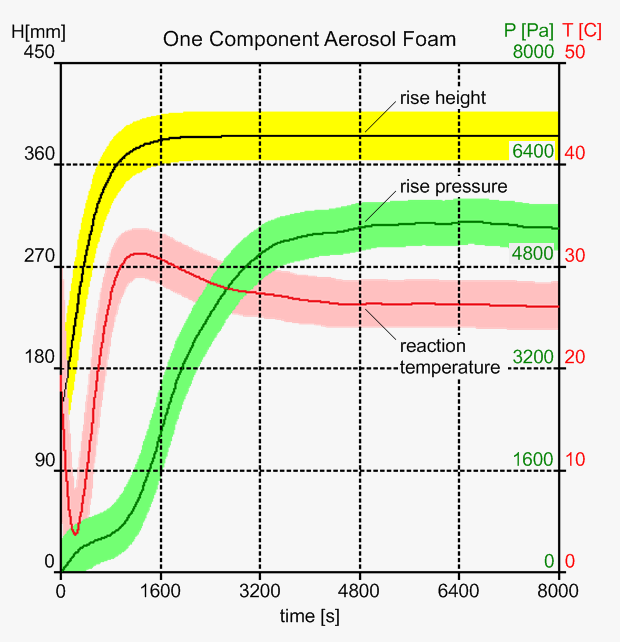
    Figure 3: The curves show the reaction of a rigid foam measured by FOAMAT with FPM/CMD 150. Rise height (H), reaction temperature (T), rise pressure (P), and dielectric polarization (D) are recorded simultaneously by the software FOAM. The colored areas are master curves for QC.

    top

    Rise Pressure


    Pressure builds up in the foam after the components have set. Stable cell walls are formed which hinder further foam expansion. The remaining blowing agents are trapped and heated. The increasing gas pressure causes stress within the foam. High pressure forces are generated by rigid foams in the production of wall elements and insulation panels. They are stressed at right angles to the direction of foam flow. In cylindrical test containers the stress at the bottom of a rigid foam sample can reach high values. The resulting load is named the "rise pressure" as it depends on the total rise height. The rise pressure is measured with the patented FPM (Foam Pressure Measurement) device, which is available with cylinder diameters of 70, 100 and 150mm. The FPM replaces normal test cups and boxes.
    Whereas the rise curve reflects the blowing agent generation, the rise pressure mirrors the cell properties, which are affected by the polymerization reaction. Pressure measurement can yield valuable information about the effects of catalysts on gelling. Furthermore the rise pressure determines the blow off point of flexible foams and it can distinguish between open and closed cell formation. The pressure curve reveals the objective gel point. For production purposes, the pressure decay indicates the demolding time. Since the foam can expand freely to the top while the pressure is being measured, FOAMAT is able to measure the rise profile simultaneously. FPM devices are available with different cardboard cylinder diameters. For high density foams or low extrusion rates the FPM 70 is recommended. Its expansion volume is confined by cardboard tubes of 70mm diameter. For low density foams and big foam samples the FPM 150 is preferred. The FPM 2 with 100mm cylinder diameter has all-round features and can be used for many types of foam.


    FPM 150

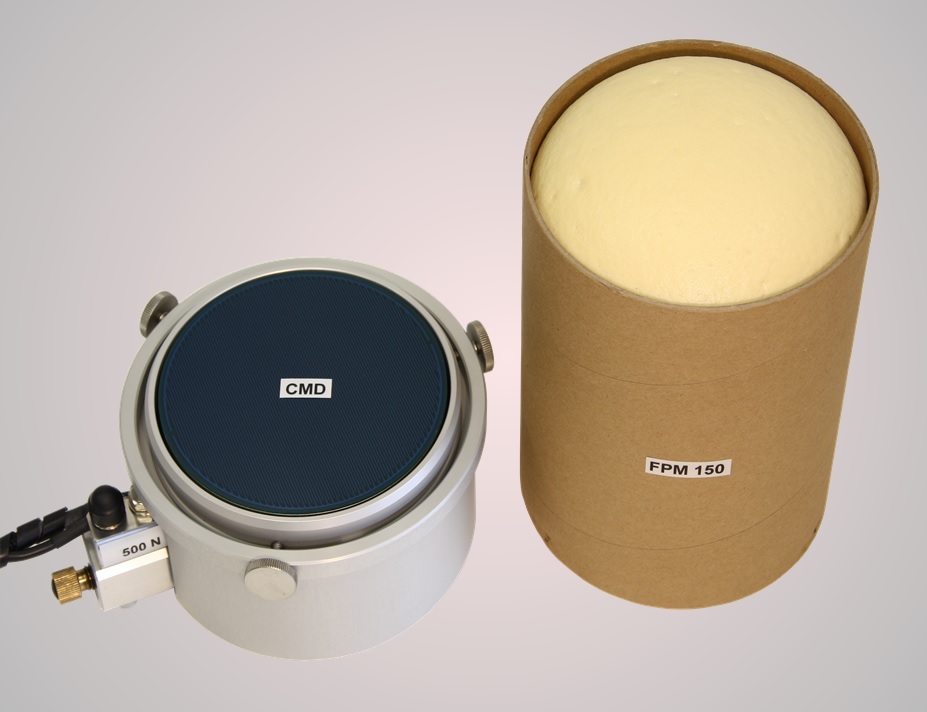
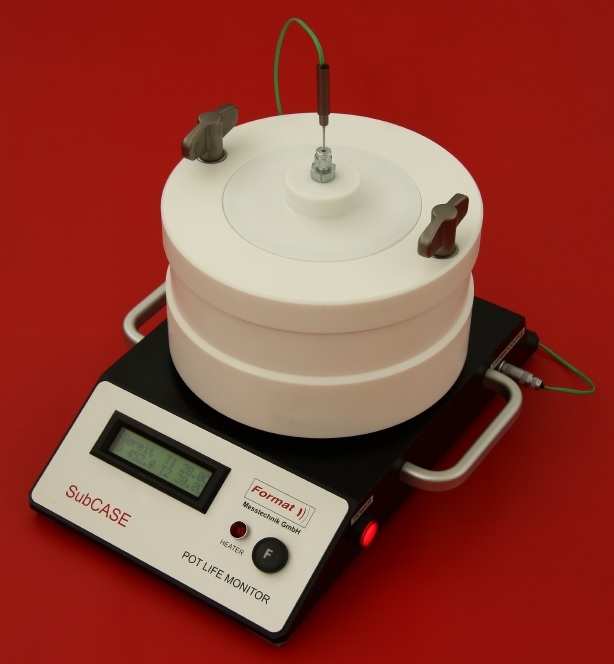
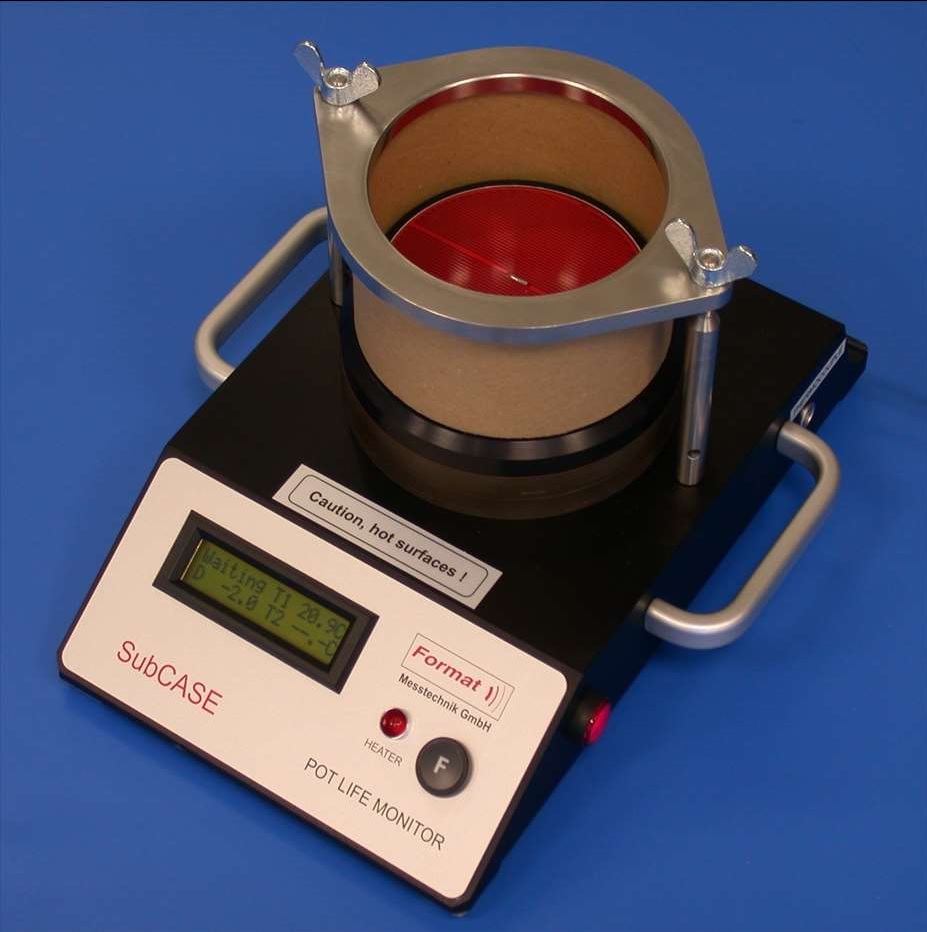
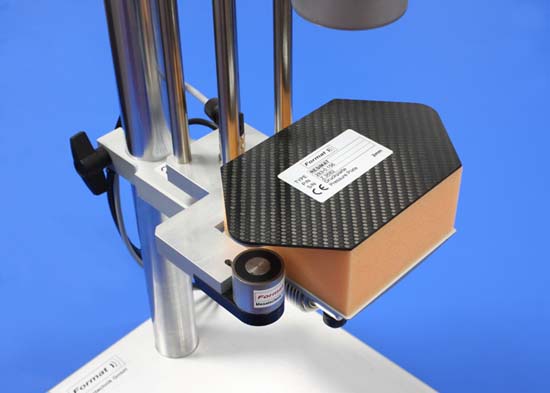
    Figure 4: The CMD (Curing Monitor Device) sensor is mounted on top of the FPM 150 pressure plate (left), enabling the simultaneous measurement of the dielectric polarization and the rise pressure. The cardboard cylinder (right) with the cured foam sample can be removed from the FPM 150 device.

    top

    Dielectric Polarization


    The dielectric polarization is a measurement parameter that gives insight into the electrochemical processes occurring during foam formation. Dielectric polarization is essentially caused by chain-like molecules with a large dipole moment due to their polar ends (OH, NCO groups for PU and PIR foams). Chain formation precedes the cross-linking reaction that ultimately suppresses all dipole mobility by curing. The dielectric polarization sensor CMD (Curing Monitor Device) is located on the pressure plate of the FPM. Due to the rise pressure, the foam is pressed onto the surface of the CMD. The dielectric polarization shows the formation of intermediates like amine and the final curing of the foam by decreasing to a low and constant signal after the chemical reaction has been completed. CMD is provided in combination with the pressure measurement device FPM. In order to simulate the production conditions in a mold, the CMD sensor can be heated with an electrical closed loop control.


    top

    Loss of Weight


    In order to obtain reproducible measurement data, the reaction components must be weighed exactly. Despite the utmost care on behalf of the user, remnants adhering to the mixer head and remaining in the mixing cup may lead to uncertainties in the tested foam mass. The integration of a laboratory balance into the FOAMAT system automatically records the mass of each component in the batch documentation. Additionally, the loss of weight due to the release of blowing agents and volatile components during foaming process, as well as due to the buoyancy can be recorded continuously. Another advantage of the balance integration is the determination of the foam density from the mass of the finished foam sample and its final rise height.


    balance

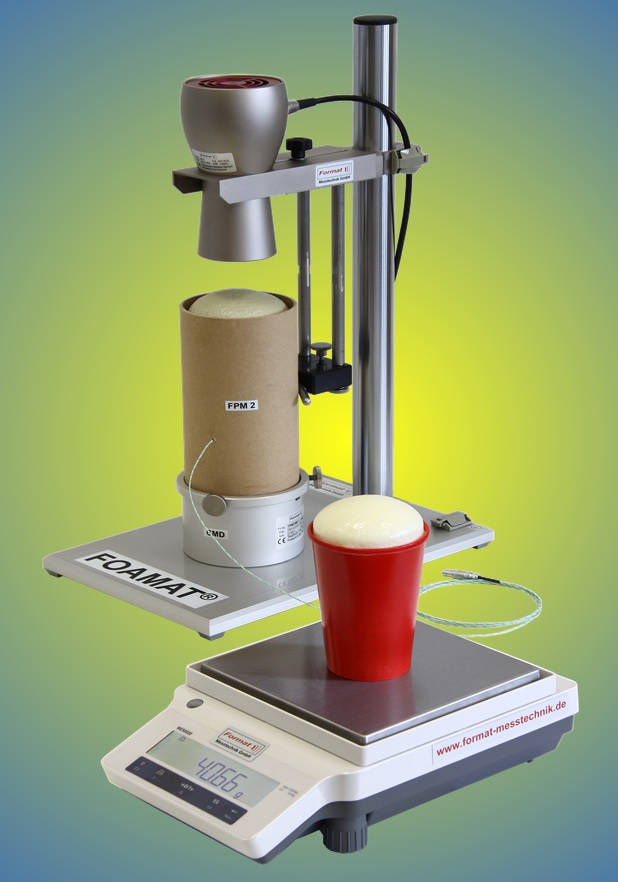
    Figure 5: The loss of weight is measured by a laboratory balance integrated into the FOAMAT system. The foam residue left in the mixing cup is used for this purpose.

    top

    Ambient conditions


    The ambient data is measured by the meteorological station GFTB 200. The room temperature, the relative humidity and the air pressure is recorded automatically by the software FOAM. All meteorological data is stored with the other test data and displayed with the other measurement parameters.


    BFC 200

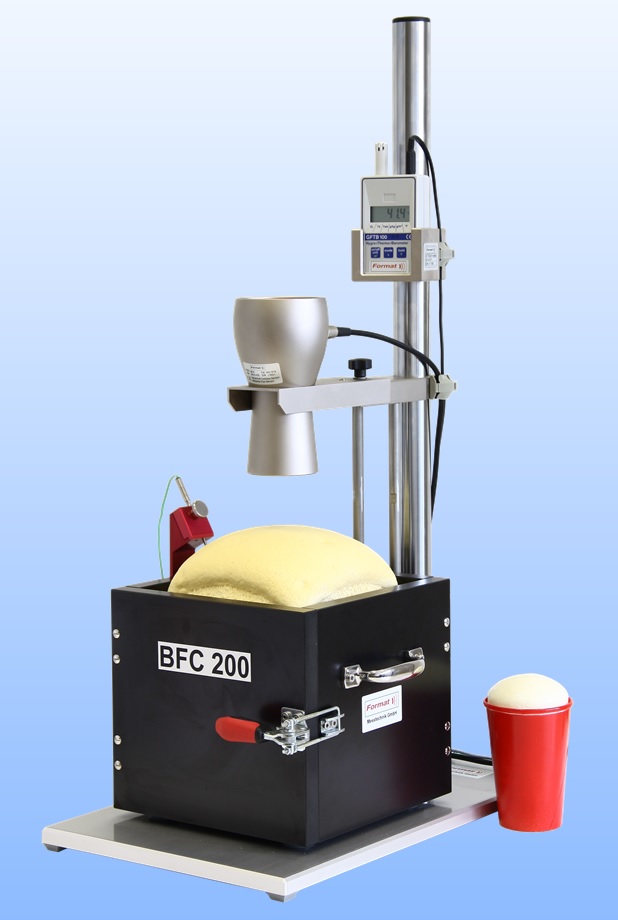
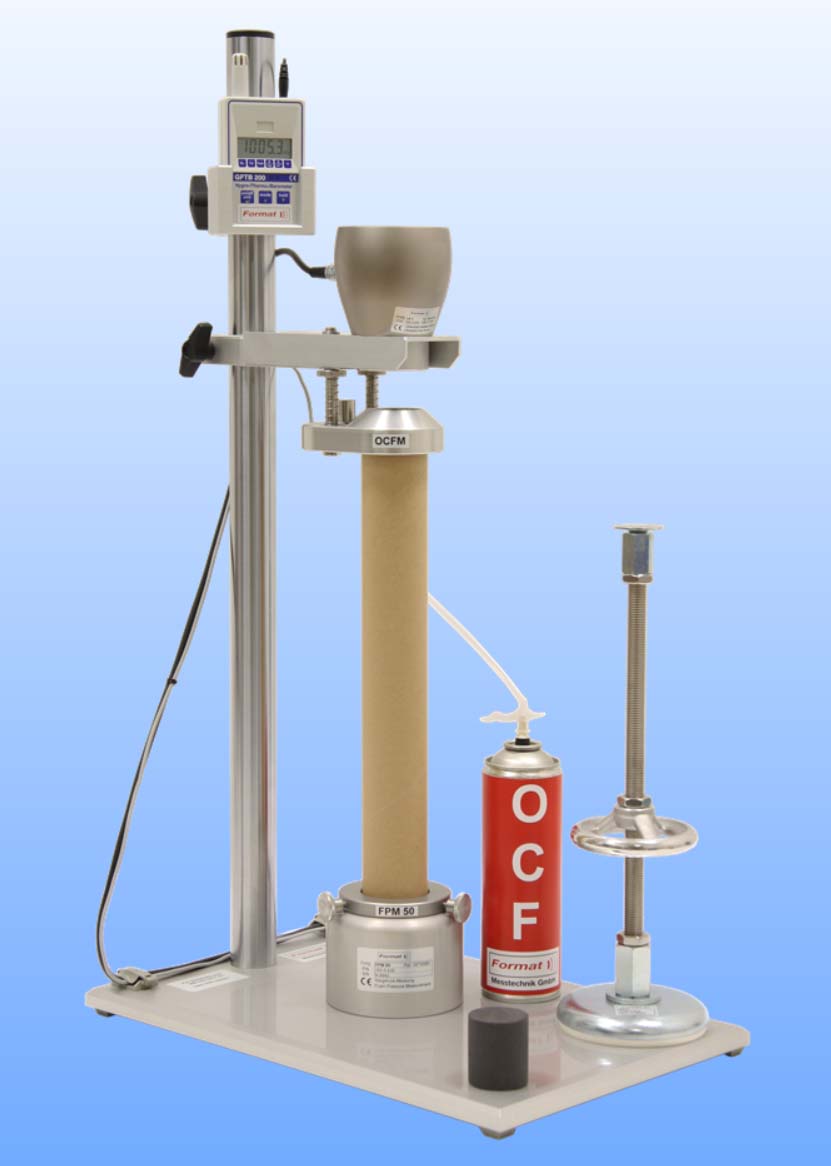
    Figure 6: The BFC 200 (Box Foam Container) is placed onto the base plate of the stand. A thermocouple is inserted into the foam using a special positioning holder. The ambient data is measured by the meteorological station GFTB 200.

    top

    Production Simulation


    Disposable cups, boxes and cardboard cylinders are commonly used to measure the physical generation parameters of reactive foam formulations. These are typically non-temperature controlled test containers. In real production, however, molds and other foam surfaces are precisely thermostated. Undefined temperatures spoil the correlation between laboratory investigation and the production situation. This is critical especially for PIR and phenolic foams which only cure at elevated temperatures. The Advanced Test Container ATC and the larger version ATC XL overcome this problem by two temperature controlled closed loops for heating the bottom plate and the semi-cylindrical side walls. For measuring the foam formation parameters they comprise both, a Foam Pressure Measurement (FPM) and a Curing Monitor Device (CMD). Additionally the core temperature is measured with a thermocouple being inserted through the ATC wall. The ATC is re-usable and replaces consumables like cups, cardboard cylinders, and paper boxes.


    FPM 70

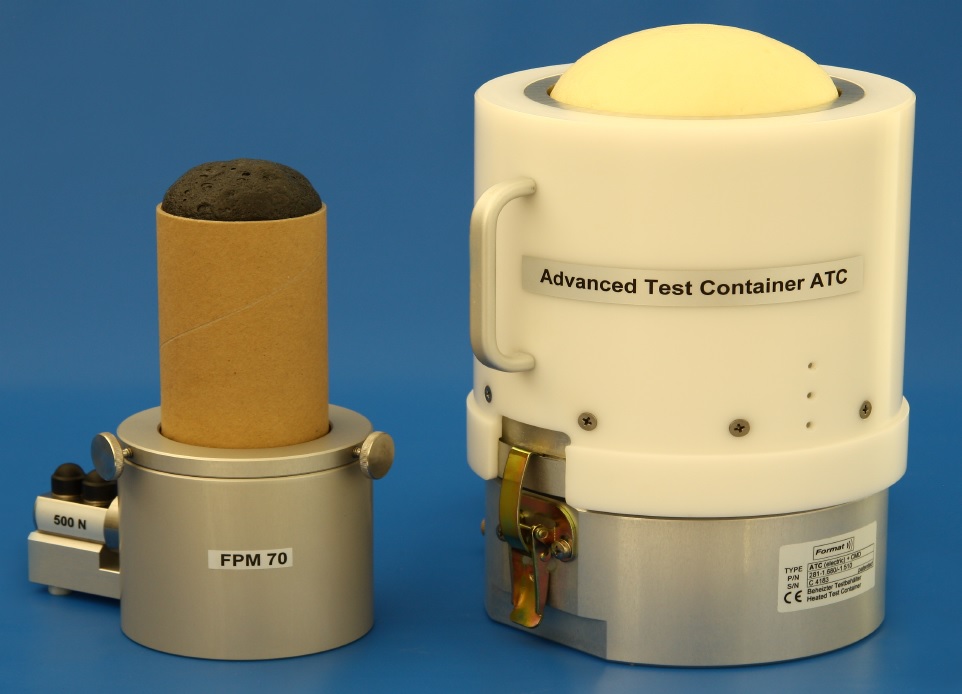
    Figure 7: Size comparison of two FOAMAT test containers: The FPM 70 (left) is designed for rise height and pressure measurement of high density foam samples. The picture shows a sealing foam in a 70mm cardboard cylinder. The Advanced Test Container ATC (right) is heatable from the bottom to the top and has semi-cylindrical side walls. The lower part contains a FPM/CMD 150 device for pressure and polarization measurement. The insulated upper part can be lifted to ease the ejection of the cured foam sample.

    top

    Reliable Test Results


    Due to consistent temperatures, the measurement results of ATC are much more reproducible than those measured in non-thermostated test containers. The decrease of the dielectric polarization reveals information about the curing process. As expected, curing goes faster at higher temperatures and more foam volume is generated. The pressure data is more consistent when measured with ATC.


    ATC XL

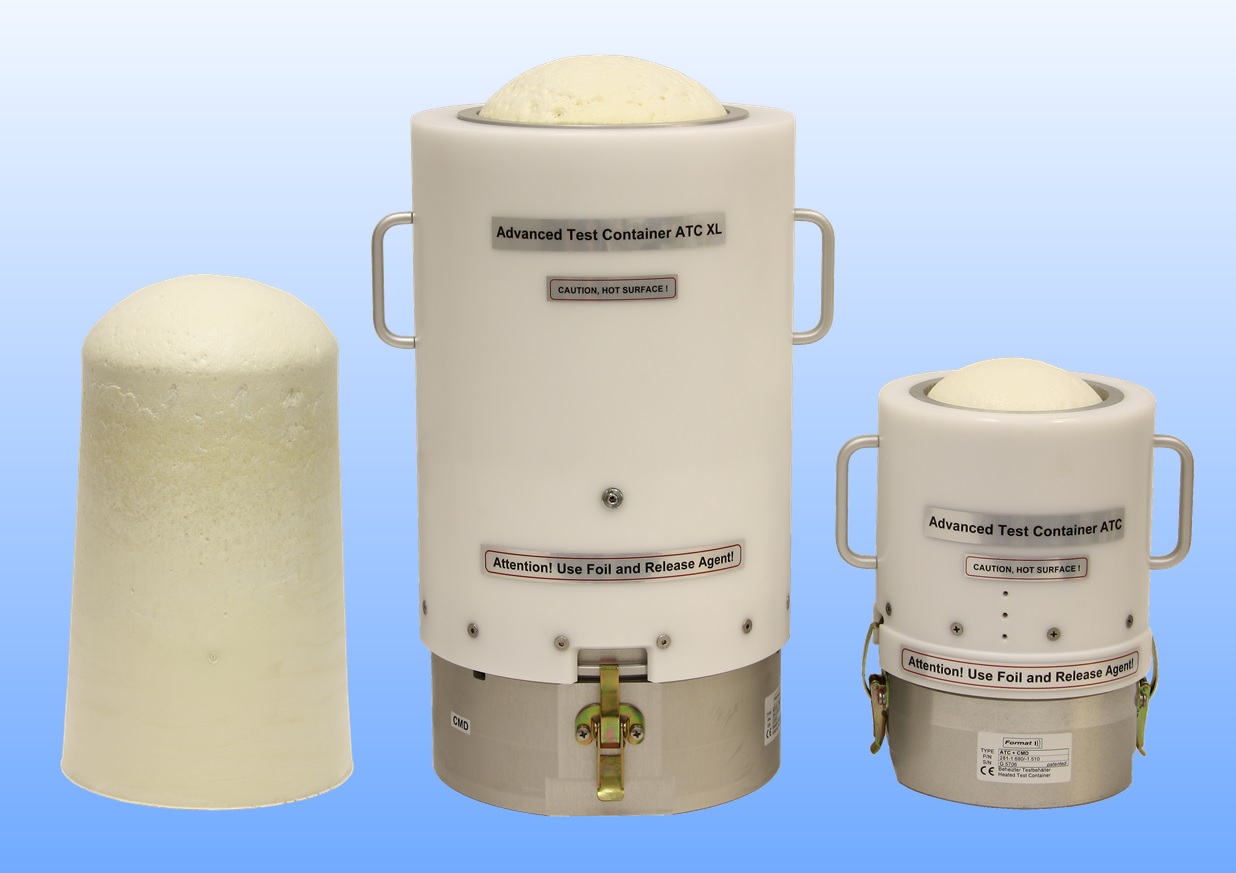
    Figure 8: The Advanced Test Container ATC XL (center) has four times the test volume of the standard ATC (right). Each of them comprises an upper and a lower part, which are clamped by spring locks. The foam sample (left) can easily be removed from the upper part.

    top

    Easy Handling


    Upon test completion, the ATC spring locks are released. The upper part of the ATC can be lifted and the foam sample can be removed easily from the device.


    In combination with the established Foam Qualification System FOAMAT, the ATC is a versatile accessory for measuring foam parameters of all types of formulations under selectable temperature conditions. The pressure and the dielectric polarization data provide valuable information how additives influence the gelling and curing of the foam. Featuring consistent elevated temperatures, the ATC opens a new dimension in QC and development of PU, PIR, EPOXY and phenolic foam formulations.


    flexible foam

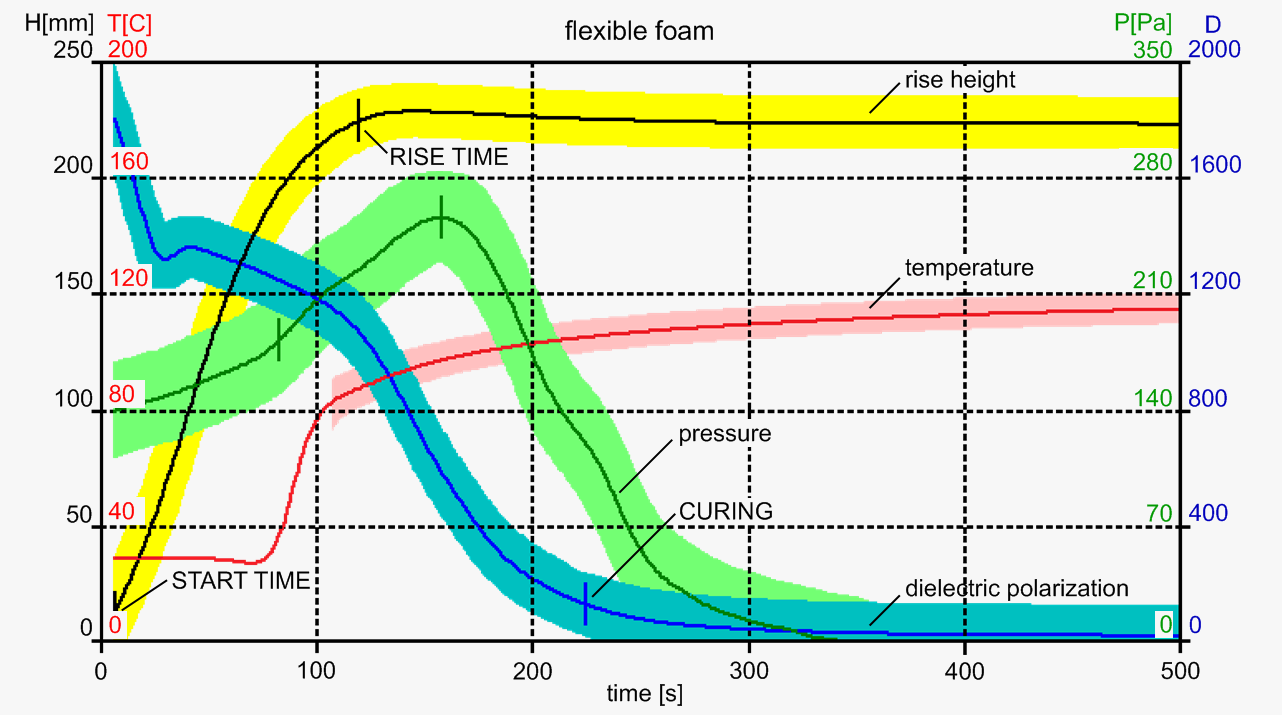
    Figure 9: Rise profile (H), temperature (T), rise pressure (P), and dielectric polarization (D) curves of a flexible polyurethane (PU) foam. The start time and rise time are evaluated from the rise height data. The curing time is determined from decrease of the dielectric polarization.


    Order No. 285256

    SubCASE®


    Pot Life and Curing Monitor

    SubCASE HT

    for Reactive


  • Coatings
  • Adhesives
  • Sealants
  • Elastomers

  • based on


  • PU formulations
  • EP, UP, and MMA resins

  • * Patent No. 102004001725

    Figure 1: The Test device SubCASE HT* can measure the pot life and the curing of reactive plastics. It is designed for high reaction temperatures. The core temperature is measured by a reusable thermocouple inserted vertically into the center of the plastic sample.

    top


    Video 1: SubCASE HT test of a PU coating formulation.


    top

    Pot Life Monitor


    SubCASE is a laboratory device for measuring the pot life and the curing behaviour of Coatings, Adhesives, Sealants and Elastomers (C.A.S.E.). The measurement device is especially designed for testing polyurethane, epoxy and polyester formulations. The compact mechanical design of SubCASE combines dielectric polarization measurement by using a CMD-sensor (Curing Monitor Device) and temperature measurement by a thermocouple and a PT transducer.


    top

    CMD-Sensor


    The dielectric polarization is the key value in measuring chain formation and cross-linking of reactive plastics. It reveals the reaction profile of the entire chemical process starting off with the reactive mixture and finally ending with a cured compound. The dielectric polarization and temperature data is obtained from the very beginning of the chemical reaction. Additionally the core temperature in the center of the test sample is measured by means of a vertically inserted thermocouple (TC). Testing under production near conditions is accomplished by heating the CMD-sensor to any production relevant temperature. Two SubCASE versions are available, the SubCASE 110°C with a maximum heater temperature of 110°C and the SubCASE HT with a maximum heater temperature of up to 150°C. The core temperature of the chemistry can reach much higher temperature values than the maximum heater temperature. The user-friendly software SUBCASE controls the measurement cycle. It acquires, displays and evaluates the measurement data.


    PU elastomer

    Figure 2: The curves show the dielectric polarization D and the surface temperature T1 of a polyurethane (PU) elastomer. The D master and the T master are margins for QC purpose. The pot life and the curing are evaluated from the dielectric polarization curve and its derivative.

    top

    Test Cycle


    The mixing time, the test time, and the heater temperature, are free selectable parameters in the software SUBCASE. The formulation data and additional comments can be inserted into an extra spread sheet. The reactive mixture can automatically trigger the data acquisition, when poured into the test container. After completion of a test, physical values like pot life and curing are evaluated from the measured curves and are listed together with other input data in a parameter list. Up to ten tests can be displayed and printed superimposed using the curve comparison function of the software SUBCASE. When a test is finished, the cardboard cylinder containing the cured sample is pulled off the CMD-sensor. The thermocouple can be pulled out and can be reused for further tests.


    SubCASE 110C

    Figure 3: The Test device SubCASE 110°C is designed for measuring the pot life and the curing of Coatings, Adhesives, Sealants and Elastomers (C.A.S.E.). The reaction profile is determined by a dielectric polarization and a temperature measurement.

    epoxy

    Figure 4: Reaction profile of an epoxy (EP) resin measured with SubCASE HT. The core temperature T2 is detected by a thermocouple centered in the test sample. The curves are examples and they may differ for other formulations.

    UP

    Figure 5: The dielectric polarization D the surface temperature T1 and the core temperature T2 of an unsaturated polyester (UP) resin measured with SubCASE HT.

    UP

    Figure 6: The SubCASE LT is designed to measure the gelling and curing reaction at low and constant temperatures.

    top

    Order No.
    SubCASE 110C: 300120
    SubCASE HT: 300130
    SubCASE LT: 300140

    Resimat®


    Recovery Measurement of Viscoelastic Foams


    Resimat 150
  • Meets IKEA® specification IOS-MAT-0076
  • Pressure relaxation during compression
  • Adjustable strain by mechanical alignment
  • Viscoelastic appearance calculation
  • Two mechanical setups for different sample size


  • * Patent No. 10252211


    Figure 1: Resimat 150* is designed for the measurement of the recovery time of viscoelastic foams according to IKEA® specification IOS-MAT-0076. The cubic test sample (red) has an edge length of 150 mm. The foam sample is compressed by the pressure plate. The ultrasonic sensor measures the time dependent thickness of the sample and a force sensor reads the restoring force.

    top


    Video 1: Resimat 150 system overview and test of a viscoelastic foam.


    top

    Visco-Elasticity


    Viscoelastic foams show a characteristic creep behavior when loaded by an external force, e.g. the weight of a body. This makes them comfortable when being used in bedding and seating applications. Resimat 100 and 150 are devices specially designed for testing the dimensional recovery properties and the pressure relaxation of viscoelastic foams. If a Resimat 150 is used, the recovery time according to IKEA® specification no. IOS-MAT-0076 can automatically be detected by the Windows based software RESIMAT. The device can be used for development as well as for quality assurance testing of viscoelastic foams.


    top

    Measurement Cycle


    A test sample with the dimensions 100x100x50 mm³ (Resimat 100) or 150x150x150 mm³ (Resimat 150) is compressed vertically by means of a pressure plate onto an adjustable reference surface. At a certain compression clamps fix the pressure plate and keep the strain for a pre-selected hold time. The software RESIMAT supports this procedure.
    While being compressed a force sensor measures the restoring force of the foam sample. Due to its viscous properties the force gradually decreases revealing the comfort parameters of the foam. After the hold time the clamps instantly release the pressure plate. The sample gradually recovers from the deformation regaining its original shape. An ultrasonic sensor positioned right above the pressure plate continuously records the kinetics of the sample surface. The thickness vs. time curve shows the recovery process giving further insight into the dynamical features of the foam.


    Resimat 100

    Figure 2: Mechanical setup of Resimat 100 for measuring viscoelastic foam samples of typical 100x100x50mm³.

    top

    Test Results


    For tests according to IOS-MAT-0076 a strain of 75% and a hold time of 60 seconds is specified. After compression and subsequent recovery, the time dependent data is displayed graphically. The recovery time according to IOS-MAT-0076 is detected when 90% of the original thickness is reached. The viscoelastic appearance is the area between the recovery curve and the original sample thickness. The recovery time, the appearance and other test parameters evaluated from the curves are listed in a parameter list together with the input data.


    Resimat 150 graph

    Figure 3: The restoring force (F) shows the relaxation during the hold time. The thickness (H) vs. time curve shows the free recovery after releasing the pressure plate. The recovery rate (v) is the differential of the thickness curve. The red area shows the “appearance”.

    Resimat 150 comparison

    Figure 4: Graphical overlay of three Resimat® 150 measurements of different foam samples. The recovery time according to IOS-MAT-0076, is the time needed to regain 90% of the original shape after a 75% compression for 60 seconds.

    top

    Order No:
    Resimat 150: 287110
    Resimat 100: 287100

    SONIC JOKER®


    Precision Ultrasonic Sensor for Distance and Thickness


    Sonic Joker
  • Maximum range 2500 mm
  • Accuracy 0.1mm
  • Self-calibration by reference bar
  • Integrated fan for air homogenization


  • * Patent Nos. 3621819, 59005295


    Figure 1: Controller Unit SONIC JOKER and two ultrasonic Fan-Sensors* FS 2 for direct thickness measurement of open celled foam.

    top

    Distance and Thickness


    SONIC JOKER is a high resolution ultrasonic measurement device designed for precise distance measurement in quality control and continuous production. Almost any solid object or liquid level can be measured with high accuracy, despite of its color and surface structure. Due to the high intensity of the ultrasonic pulses, even highly sound absorbing materials like foams, textiles and insulation mats can be measured. A standard application is the thickness measurement of products made of foam, plastic, rubber, and stones in the production process. Fill levels of liquids, pastes and granulates can also be recorded. Process control is assisted by special I/O functions. One serial output and two analogue outputs are available for data transfer. Two sensor heads are connected to one controller unit for comprehensive survey and redundancy. Free hanging foils in continuous production are measured with an anti-parallel sensor alignment.


    top

    High Accuracy


    The ultrasonic distance measurement is carried out according to the pulse/echo method. The distance between the sensor head and the reflecting object is calculated from the traveling time of the sound pulses from the sensor to the object and their echoes. The knowledge of the sound propagation conditions, i.e. the velocity of sound, is essential for a high accuracy measurement. This is achieved by the patented sensor heads FS 1 and FS 2 of SONIC JOKER: A built-in reference bar gives continuous calibration signals and compensates for temperature changes and different air composition. The integrated ventilation fan homogenizes the air volume between the sensor head and the object, thus giving definite and unspoilt sound propagation conditions for high accuracy measurements.


    top

    SONIC TOOLS


    The measurement data is transmitted continuously to a PC. The software SONIC TOOLS comprises subroutines for setting SONIC JOKER parameters and continuous production survey with limit control.


    Sonic Joker parallel
    Figure 2: SONIC JOKER with controller unit and two sensor heads for parallel thickness measurement of a moving object using a reference surface.

    top


    Sonic Joker anti parallel
    Figure 3: SONIC JOKER with controller unit and two sensor heads in an anti-parallel alignment for thickness measurement without support.

    top


    SONIC TOOLS
    Figure 4: The PC software SONIC TOOLS in the production control mode for continuous thickness measurement within defined limits.

    top

    Order No. 270200

    LRS 3


    Ultrasonic Distance Sensor


    LRS 3
  • Measuring range from 30 mm to 2000 mm
  • High resolution of 0,01 mm
  • Temperature compensation by integrated temperature sensor
  • Serial interface RS 232 C
  • Adjustable output gradient for current and voltage
  • Selectable sensor gain

  • Figure 1: Basic Unit LRS 3 with sensor-head SP 40

    top

    Distance and Thickness Measurement


    The ultrasonic distance sensor LRS 3 comprises the ultrasonic sensor head and the basic unit with integrated display and function key. The new circuit technology and its programmable functions make the LRS 3 a perfect sensor for all kinds of non-tactile distance and thickness measurements. LRS 3 combines a large measuring range with high accuracy at the physical limits. Ranging is performed by emitting and detecting ultrasonic wave packages in air. The traveling time of the ultrasound from the sensor to the object and back is determined by using a fast responding foil transducer. The resolution of the sensor LRS 3 is better than 0,01 mm. The precision of the measurement is only depending on the homogeneity of the air. The sensor-head has an integrated temperature-sensor for measuring the mean air temperature. From this the velocity of the ultrasound is calculated. The measured distances are displayed on the LED-display of the basic unit and are transmitted to a PC or other devices via a serial interface. By the function key the user can switch between relative and absolute measurement.
    The software LRS - TOOLS allows changing of the measurement parameters, such as upper and lower range limit, number of averaged cycles, analogue output gradient, sensor gain and relative / absolute measurement. LRS 3 can thus be adapted to the specific application. All kinds of objects made of concrete, stone, metal, plastic, wood, paper and glass can be measured. Even highly sound absorbing materials like foams, textiles and insulation mats can be detected not regarding their surface structure. The measurement is independent of the colour and other optical effects. A typical application is the on-line thickness measurement of products made of rubber, canvas, felt and concrete during the production process.


    top

    Software LRS - TOOLS


    The software LRS - TOOLS is used for the adjustment of the basic unit according to the specific application, and for the display of the measurement data transmitted via the serial interface.


    Measuring Range

    Inserting an Upper Limit and a Lower Limit determines the measuring range. The lowest measurement limit is 30 mm; the highest limit is 2000 mm.


    Relative measurement

    By activating the option fields the user can select between absolute and the relative distance measurement, respectively. Clicking on Zero gives a Reference Distance, which is needed for direct thickness measurement. The reference distance is applied in the relative mode.


    Average

    The average is the number of measurement cycles needed for one new distance output.


    Analogue Output

    The gradient of the voltage output in millivolts per millimetre displacement (mV/mm) can be changed in the edit field Gradient. The offset in millimetre of the analogue output can be inserted into the edit field Offset.


    Sensor Gain

    The sensor Gain can be changed to the levels Low, Standard and High using selection arrows. By the sensor gain you may select the optimum sensitivity required for your object, avoiding too much attenuation or multiple echoes.


    LRS 3 principle
    Figure 2: Thickness measurement of an object lying on a reference-surface
    d = thickness of the object
    d0 = reference-distance
    d1 = distance of the object

    top


    LRS 3 software
    Figure 3: Spread sheet of the software LRS - TOOLS

    top

    Order No. 282200

    O C F M


    One Component Foam Measurement


    OCFM
  • Rise profile in a narrow cardboard cylinder
  • Reaction temperature
  • Foam Pressure Measurement FPM 50
  • Cylinder alignment by innovative holder
  • Accessory to the FOAMAT® system


  • * patent pending


    Figure 1: The One Component Foam Measurement device OCFM has a special holder for aligning the FPM 50 and the cardboard cylinder under the ultrasonic sensor. The Perfect Preparation Aid PPA (right) helps to inject a defined amount of froth.

    top


    Video 1: OCFM system overview and test of a one component foam.


    top

    One Component Foam Measurement


    The One Component Foam Measurement device OCFM* is specially designed to measure the rise profile, the rise pressure, and the reaction temperature of One Component Foams (OCF). The OCFM comprises a cylindrical expansion container, filled with the OCF froth, and a special holder for aligning the expansion container under an ultrasonic distance sensor.


    OCFM graph
    Figure 2: The curves show the reaction of a One Component Foam (OCF) measured with OCFM and FOAMAT. The rise height (H), the rise pressure (P), and the reaction temperature (T) are recorded simultaneously.

    top

    Order No. 281259